BigSnarf blog

Infosec FTW

AutoDiff

Unsupervised Reinforcement Learning

Data Pipeline visualized

pipeline

Cat or Dog

SelmanDesign_Q-A_CATorDOG-flow

Stats -> ML -> AI

Screen Shot 2018-10-04 at 8.33.24 PM

Image Retrieval Using Deep Learning

RMAC RESNET

We propose a novel approach for instance-level image retrieval. It produces a global and compact fixed-length representation for each image by aggregating many region-wise descriptors. In contrast to previous works employing pre-trained deep networks as a black box to produce features, our method leverages a deep architecture trained for the specific task of image retrieval. Our contribution is twofold: (i) we leverage a ranking framework to learn convolution and projection weights that are used to build the region features; and (ii) we employ a region proposal network to learn which regions should be pooled to form the final global descriptor. We show that using clean training data is key to the success of our approach. To that aim, we use a large scale but noisy landmark dataset and develop an automatic cleaning approach. The proposed architecture produces a global image representation in a single forward pass. Our approach significantly outperforms previous approaches based on global descriptors on standard datasets. It even surpasses most prior works based on costly local descriptor indexing and spatial verification1

Click to access 1604.01325.pdf

https://arxiv.org/abs/1511.05879

https://arxiv.org/abs/1510.07493

https://arxiv.org/abs/1610.07940

https://github.com/figitaki/deep-retrieval

https://www.kaggle.com/c/landmark-retrieval-challenge/discussion/57855#335578

RL

RateMyView

Screen Shot 2018-05-21 at 12.42.48 PMScreen Shot 2018-05-21 at 12.42.41 PMScreen Shot 2018-05-21 at 12.42.35 PMScreen Shot 2018-05-21 at 12.42.28 PM5

Clustering photos for labels

  1. Histograms of RGB
  2. KMeans Histograms
  3. Autoencoder KMeans
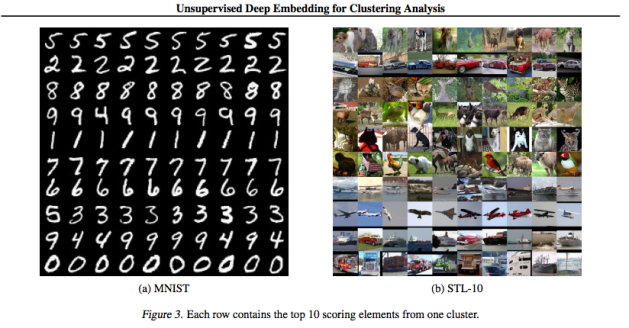
  4. Unsupervised Deep Embedding for Clustering Analysis (DEC)

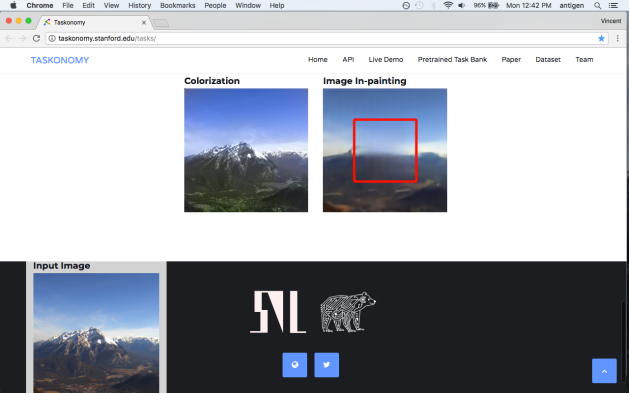
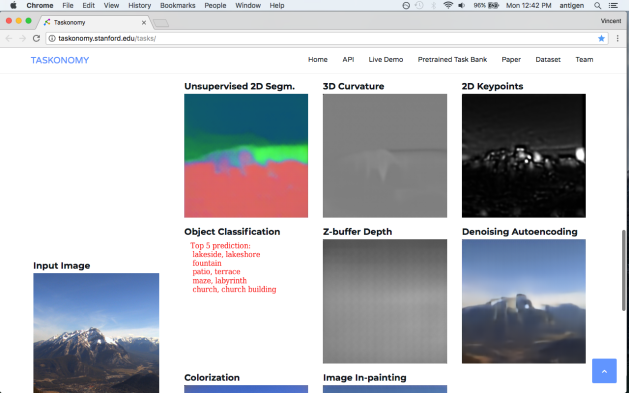
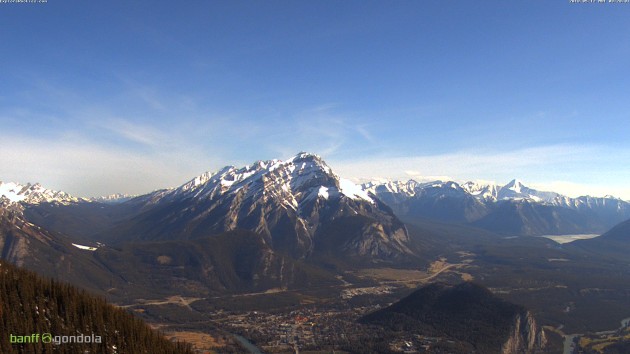
I have 50000 photos that I would like to label for training a classifier. I guess I could represent each image by raw pixels or RGB values but how do I divide them into K groups in terms of inherent latent semantics? Solutions 1, 2 and 3.

The traditional way, you first extract feature vectors according to domain-specific knowledge and then use a clustering algorithm on the extracted features.

My colleague said I had to use deep learning so I researched it and found DEC. A unified framework which can directly cluster images with linear performance. This new category of clustering algorithms using Deep Learning is typically called Deep Clustering.

From the paper:

Clustering is central to many data-driven application domains and has been studied extensively in terms of distance functions and grouping algorithms. Relatively little work has focused on learning representations for clustering. In this paper, we propose Deep Embedded Clustering (DEC), a method that simultaneously learns feature representations and cluster assignments using deep neural networks. DEC learns a mapping from the data space to a lower-dimensional feature space in which it iteratively optimizes a clustering objective. Our experimental evaluations on image and text corpora show significant improvement over state-of-the-art methods.

Click to access 1511.06335.pdf

Screen Shot 2018-05-15 at 10.06.49 PM

Screen Shot 2018-05-15 at 10.18.34 PM

https://github.com/fferroni/DEC-Keras/blob/master/keras_dec.py

https://github.com/XifengGuo/DEC-keras/blob/master/DEC.py

Click to access ICONIP17-DCEC.pdf

https://arxiv.org/abs/1709.08374

https://github.com/panji1990/Deep-subspace-clustering-networks

Visual Vocabulary

Designing with data

There are so many ways to visualize data – how do we know which one to pick? Use the categories across the top to decide which data relationship is most important in your story, then look at the different types of chart within the category to form some initial ideas about what might work best. This list is not meant to be exhaustive, nor a wizard, but is a useful starting point for making informative and meaningful data visualizations.


https://github.com/ft-interactive/chart-doctor/tree/master/visual-vocabulary